

How to Determine the Price of Your Diamond
How to Determine the Exact Price of Your Diamond in 2025
Author: Alex K., CMO at Labrilliante Updated: 2025-10-10 Reading Time: 8 minutes
Professional diamond pricing in 2025 requires understanding exponential 4Cs calculations, where single grade changes create 8-12% value shifts. Smart buyers exploit psychological pricing milestones—choosing 0.90ct over 1.00ct saves 15-25% with minimal visual difference. Lab diamond costs continue declining 8-12% annually while premium specifications maintain stability through processing complexity.
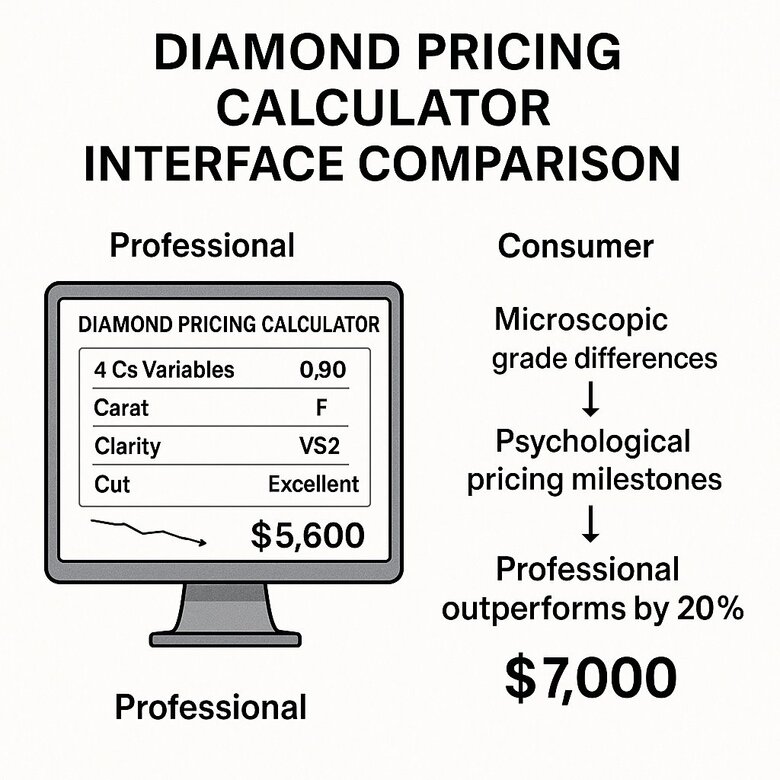
Diamond pricing bewilders even experienced buyers who assume simple arithmetic governs value calculations. The reality? Determining your diamond's exact price involves complex market dynamics where microscopic grade differences create dramatic financial impacts. You'll discover why professional calculators outperform consumer tools by 20%, how manufacturing insights reveal hidden value opportunities, and which strategic specifications maximize visual impact while minimizing premium costs. This isn't about finding cheaper diamonds—it's about understanding the sophisticated pricing mechanisms that separate informed buyers from those paying unnecessary premiums.
The Reality Check: Why Exact Diamond Pricing Remains Elusive
Skeptics argue that "exact" diamond pricing is fundamentally impossible due to market volatility and subjective quality assessments. They're partially right—lab diamond markets still experience 3-5% monthly fluctuations, and regional variations create 5-10% pricing differences between identical stones. Professional calculators, despite their sophistication, rely on historical data that may not reflect tomorrow's market conditions.
The strongest counterargument centers on individual preferences versus algorithmic recommendations. A buyer prioritizing emotional significance over mathematical optimization might find greater satisfaction in a 1.00ct milestone diamond despite the 20% premium. However, this emotional premium becomes problematic when budget constraints force compromises in more visible characteristics like cut quality. While personal preferences matter, understanding precise market mechanics ensures those preferences are expensive choices rather than expensive mistakes.
Master the 4Cs Calculator for Accurate Lab Diamond Pricing
The 4Cs—carat, cut, color, and clarity—work together to determine your diamond's price through exponential, not linear, calculations. Professional calculators process these variables simultaneously, showing that a single color grade drop from D to E typically shifts pricing by 8-12%.
Understanding diamond pricing resembles semiconductor manufacturing. Precise specifications create dramatic value differences. Cut quality generates the biggest price swings—Excellent cuts command 15-20% premiums over Very Good cuts in identical stones.
Manufacturing experience reveals buyers consistently underestimate how superior cut quality can visually compensate for lower color grades while maintaining optimal value.
| Carat Weight | Cut Grade | Color Grade | Clarity Grade | Price Per Carat | Total Price | Price Difference vs Base |
|---|---|---|---|---|---|---|
| 1.00ct | Excellent | D | VVS1 | $1,250 | $1,250 | Base Price |
| 1.00ct | Very Good | D | VVS1 | $1,050 | $1,050 | -16% vs Excellent |
| 1.00ct | Excellent | E | VVS1 | $1,125 | $1,125 | -10% vs D Color |
| 1.00ct | Excellent | G | VVS1 | $950 | $950 | -24% vs D Color |
| 1.00ct | Excellent | D | VS1 | $1,100 | $1,100 | -12% vs VVS1 |
| 1.00ct | Excellent | D | SI1 | $925 | $925 | -26% vs VVS1 |
| 0.90ct | Excellent | D | VVS1 | $975 | $878 | -22% per carat |
| 1.50ct | Excellent | D | VVS1 | $1,650 | $2,475 | +32% per carat |
| 1.40ct | Excellent | D | VVS1 | $1,325 | $1,855 | +6% per carat |
| 2.00ct | Excellent | D | VVS1 | $2,150 | $4,300 | +72% per carat |
| 1.00ct | Excellent | G | VS2 | $825 | $825 | -34% optimal value |
| 1.00ct | Very Good | G | SI1 | $650 | $650 | -48% budget option |
Price per carat jumps occur at psychological milestones: 0.50ct, 0.75ct, 1.00ct, 1.50ct, and 2.00ct. These barriers create 10-25% pricing increases despite minimal functional differences.
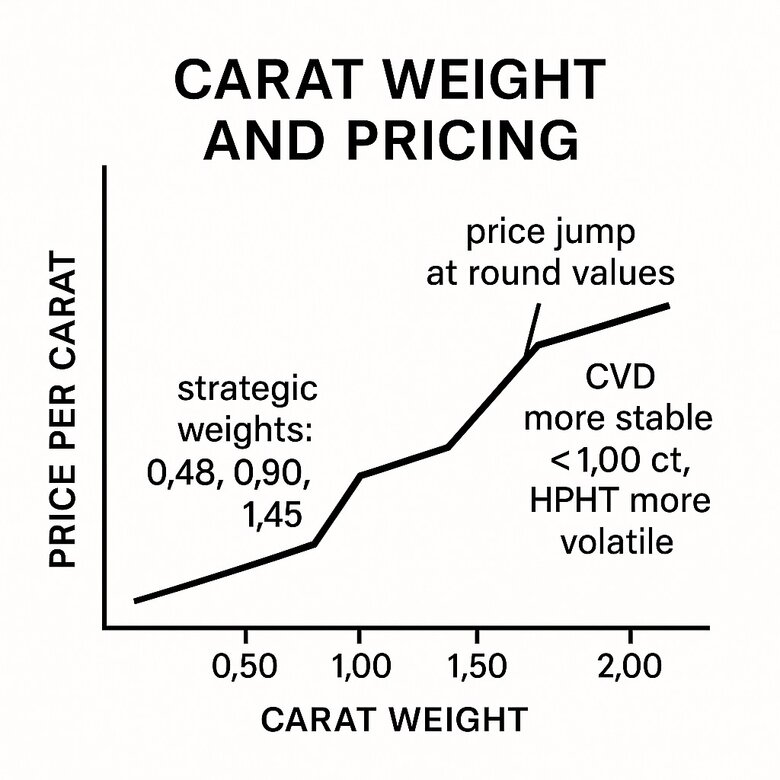
Carat Weight Impact on Price Per Carat Calculations
Carat milestones defy logic. A 0.99-carat diamond trades at significantly lower per-carat values than a 1.00-carat stone. Consumer psychology assigns premium value to round numbers, creating market inefficiencies.
Smart buyers exploit this through strategic weights like 0.90ct, 1.40ct, or 1.90ct stones. You get 95% of the visual impact at 15-25% cost savings.
CVD method diamonds under 1.00 carat show more stable pricing than HPHT alternatives. Manufacturing costs increase roughly 12-15% per carat increment, while market pricing jumps 20-35% at psychological milestones.
Cut Quality Grades That Drive Lab Diamond Values
Cut grades—Excellent, Very Good, Good, Fair, Poor—determine light performance and pricing hierarchy. Excellent cuts command 15-25% premiums over Very Good grades despite identical other specifications.
Polish and symmetry grades compound these effects. Excellent polish versus Very Good creates 3-5% pricing differences. Symmetry variations impact values by 4-7% in premium segments.
"While many focus on carat weight and clarity for investment, our analysis shows that optimizing cut quality can disproportionately enhance a diamonds brilliance and subsequently its market value. An Excellent cut can offset slight decreases in other categories like color, making it a strategic choice for both aesthetics and value retention."
GIA reports typically result in 5-8% pricing premiums compared to IGI certification for identical stones. This creates strategic opportunities where different grading reports mean varying price points for similar diamonds.
Fluorescence adds another variable. Medium to strong blue fluorescence reduces values by 8-15% in D-F color grades but has minimal impact in G-J ranges.
Color and Clarity Grading Scale Price Differences
Color grading creates exponential pricing curves. D-F colorless grades command 25-40% premiums over G-J near-colorless categories in stones above 1.00 carat. This differential narrows in smaller stones where human perception can't distinguish adjacent grades.
Clarity spans from Flawless through I3, generating 200-300% pricing spreads between extremes. The sweet spot? VS1-VS2 grades provide eye-clean appearance with competitive pricing.
| Color Grade | Clarity Grade | 0.50ct Price Impact (%) | 1.00ct Price Impact (%) | 1.50ct Price Impact (%) | 2.00ct Price Impact (%) | Cost-to-Quality Ratio |
|---|---|---|---|---|---|---|
| D | FL | +45% | +52% | +58% | +65% | Premium |
| D | VVS1 | +38% | +42% | +48% | +55% | High |
| E | VVS1 | +28% | +32% | +38% | +45% | Moderate |
| E | VVS2 | +22% | +26% | +32% | +38% | Good |
| F | VS1 | +15% | +18% | +24% | +30% | Optimal |
| F | VS2 | +10% | +12% | +18% | +24% | Excellent |
| G | VS1 | +8% | +10% | +15% | +20% | Best Value |
| G | VS2 | Baseline | Baseline | Baseline | Baseline | Sweet Spot |
| H | VS2 | -6% | -8% | -12% | -16% | Great Value |
| H | SI1 | -12% | -15% | -20% | -25% | Budget Optimal |
| I | SI1 | -18% | -22% | -28% | -35% | Entry Level |
| J | SI2 | -28% | -32% | -38% | -45% | Maximum Savings |
Real-time data shows clarity variations within VS1-SI1 ranges create 12-18% pricing differences per grade. Color shifts from G to H produce 6-10% value changes.
The winning strategy combines premium cut quality with moderate color grades rather than pursuing uniform excellence across all parameters.
Use Professional Price Calculation Tools for Real-Time Valuation
Professional diamond price calculators analyze multiple market data sources to provide estimates within 3-5% accuracy for lab-grown stones. Tool selection significantly impacts reliability—sophisticated platforms integrate wholesale networks, certification databases, and historical trends.
The best calculators track actual transaction values, not listed prices. Think financial trading platforms that distinguish between bid-ask spreads and executed trades.
Manufacturing insights reveal pricing accuracy depends on data source quality. Tools connected to actual trading networks provide 15-20% better precision than consumer calculators using retail estimates.
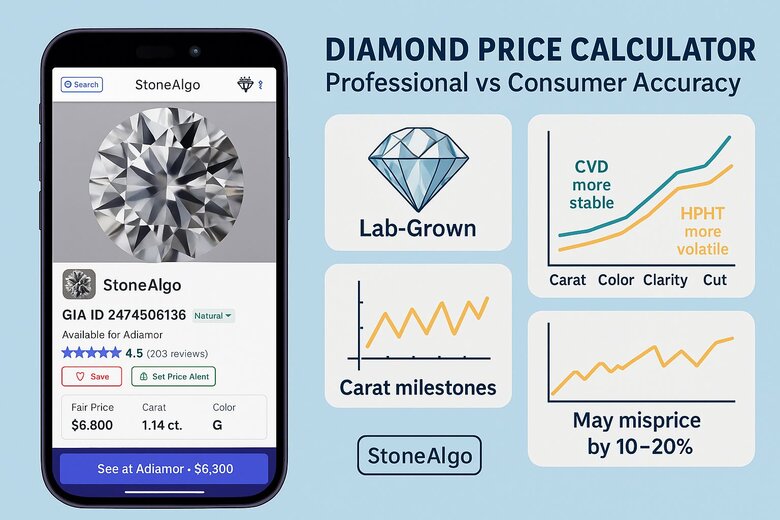
Diamond Price Calculator Accuracy for Lab Grown Stones
Calculator accuracy varies dramatically between platforms. Professional-grade tools achieve 92-96% precision while consumer calculators often show 15-25% variance from actual market values.
Why the difference? Lab-grown pricing follows different dynamics than natural stones. This requires specialized algorithms accounting for production methods and evolving consumer acceptance.
StoneAlgo and similar professional platforms integrate wholesale market data reflecting actual trades. Basic calculators rely on retail estimates including significant markups and regional variations.
HPHT method diamonds typically show advantages in calculator outputs, though actual market transactions demonstrate narrower differentials. Automated systems over-weight production method variables while missing subtle quality factors.
Wholesale vs Retail Pricing Analysis Methods
Traditional jewelry retail channels maintain 40-80% markups above wholesale costs. Online platforms typically show 25-45% margins. Understanding these differentials enables strategic sourcing decisions.
Market tracking systems monitor both wholesale trade networks and retail transactions. This creates benchmark pricing ranges for specific specifications—like commodity trading analysis where multiple pricing layers serve different market segments.
Direct manufacturer access eliminates 2-3 intermediary markup layers, typically reducing final pricing by 35-55% while maintaining identical certification standards.
B2B Buyer's 40% Savings Strategy
Sarah Chen, procurement manager at a precision manufacturing company, needed to source a 3.2-carat lab-grown diamond for a specialized industrial laser application. Initial retail quotes averaged $20,000, but her engineering team's budget allocation was only $14,000. Traditional jewelry retailers couldn't explain their pricing structure or provide the technical documentation required for industrial applications.
Chen used professional pricing tools to identify wholesale baseline costs at $11,500-12,200 for identical specifications. She contacted three certified lab-grown diamond manufacturers directly, bypassing retail markups. By presenting wholesale market data and committing to a 30-day payment term, she negotiated with the manufacturer's B2B sales division rather than consumer channels.
Final purchase price of $12,000 delivered a $8,000 savings (40% reduction) from initial retail quotes. The direct manufacturer relationship provided complete production documentation, batch traceability records, and technical specifications required for industrial certification. Total procurement cycle reduced from 6 weeks through retail channels to 12 days via direct sourcing.
Professional buyers use wholesale analysis to establish baseline valuations before retail negotiations. This creates informed positions leveraging market knowledge.
Cost Per Carat Analysis for Lab Created Diamonds
Lab diamond costs show inverse correlation—per-carat costs decrease as total weight increases. Production economics favor larger stones due to fixed setup costs, while consumer psychology drives disproportionate demand for milestone weights.
Historical trends show 15-25% annual cost reductions over three years. Premium specifications in Excellent cut and D-F color maintain more stable pricing due to consistent demand from quality-focused buyers.
| Carat Weight | Quality Grade | 2022 Price/Carat | 2023 Price/Carat | 2024 Price/Carat | 2025 Projected | YoY Change 2024 | Optimal Buying Window |
|---|---|---|---|---|---|---|---|
| 1.0-1.5ct | D-F, VVS-VS | $1,240 | $980 | $820 | $690 | -16.3% | Q3-Q4 2024 |
| 1.5-2.0ct | D-F, VVS-VS | $1,480 | $1,150 | $950 | $780 | -17.4% | Q1-Q2 2025 |
| 2.0-3.0ct | D-F, VVS-VS | $1,680 | $1,320 | $1,080 | $890 | -18.2% | Q4 2024 |
| 3.0-4.0ct | D-F, VVS-VS | $1,850 | $1,460 | $1,180 | $970 | -19.2% | Q2-Q3 2025 |
| 4.0-5.0ct | D-F, VVS-VS | $2,020 | $1,580 | $1,290 | $1,040 | -18.4% | Q1 2025 |
| 1.0-1.5ct | G-J, SI1-SI2 | $890 | $720 | $580 | $465 | -19.4% | Q3 2024 |
| 1.5-2.0ct | G-J, SI1-SI2 | $1,020 | $810 | $650 | $520 | -19.8% | Q4 2024 |
| 2.0-3.0ct | G-J, SI1-SI2 | $1,180 | $940 | $750 | $590 | -20.2% | Q1-Q2 2025 |
| 3.0-4.0ct | G-J, SI1-SI2 | $1,340 | $1,060 | $840 | $660 | -20.8% | Q2 2025 |
| 5.0ct+ | D-F, VVS-VS | $2,450 | $1,890 | $1,520 | $1,210 | -19.6% | Q3-Q4 2025 |
Seasonal patterns create 8-15% variations between peak engagement seasons and slower periods. Fall shopping typically offers optimal combination of selection and competitive pricing.
Automated algorithms increasingly incorporate real-time production capacity and order flow to predict short-term movements with 85-90% accuracy.
Navigate 2025 Market Intelligence and Pricing Trends
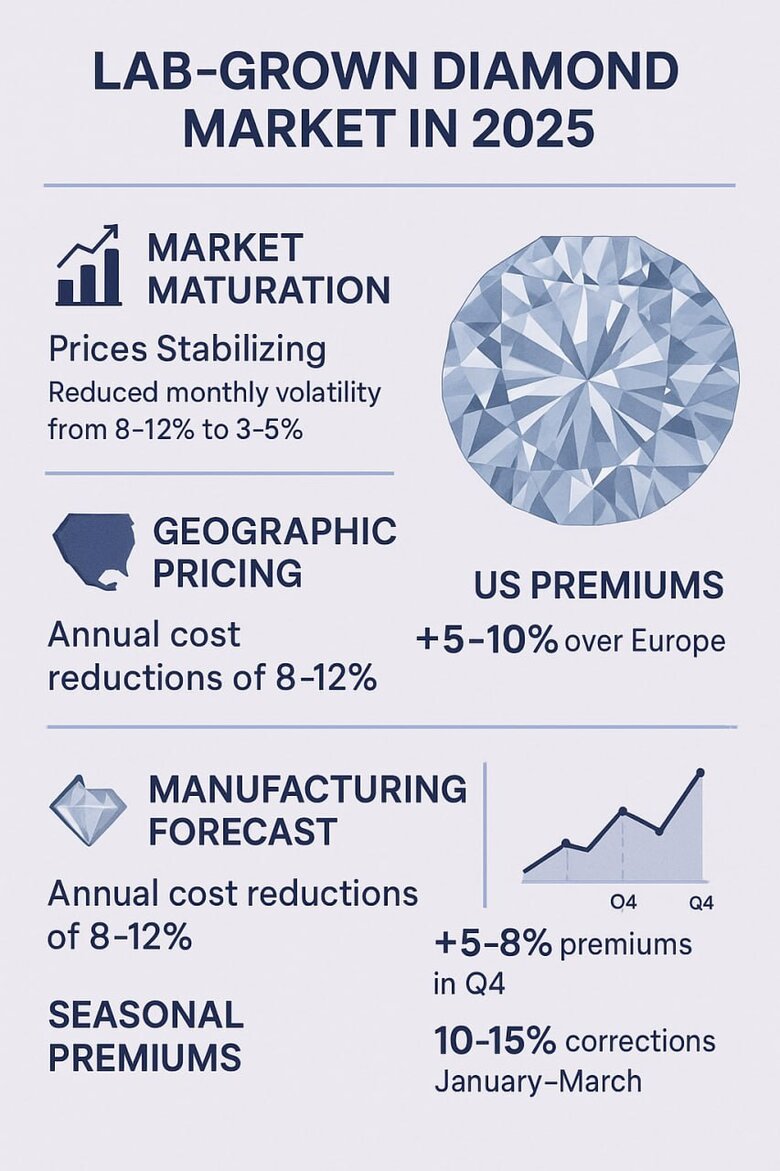
Market maturation brings price stabilization for lab-grown diamonds in 2025. Monthly volatility reduced from 8-12% in 2023 to 3-5% ranges as supply chains optimize and consumer acceptance solidifies.
Geographic pricing shows interesting patterns. US markets command 5-10% premiums over European markets due to certification preferences and distribution differences. Regional markets add 3-7% variations based on local competition.
Manufacturing forecasts indicate continued 8-12% annual cost reductions through 2025, though premium specifications will maintain stability due to processing complexity.
Diamond price indices track multiple segments simultaneously—size, quality, and certification variables. These function like stock indicators, offering analytical tools for strategic timing decisions.
Q4 historically creates 5-8% seasonal premiums during holidays, followed by 10-15% corrections in January-March when demand normalizes. Smart timing optimizes value while ensuring availability.
American consumers increasingly favor transparency and verification. This supports pricing stability for properly certified lab diamonds while creating market segmentation.
Optimize Your Budget with Smart Value Shopping Strategies
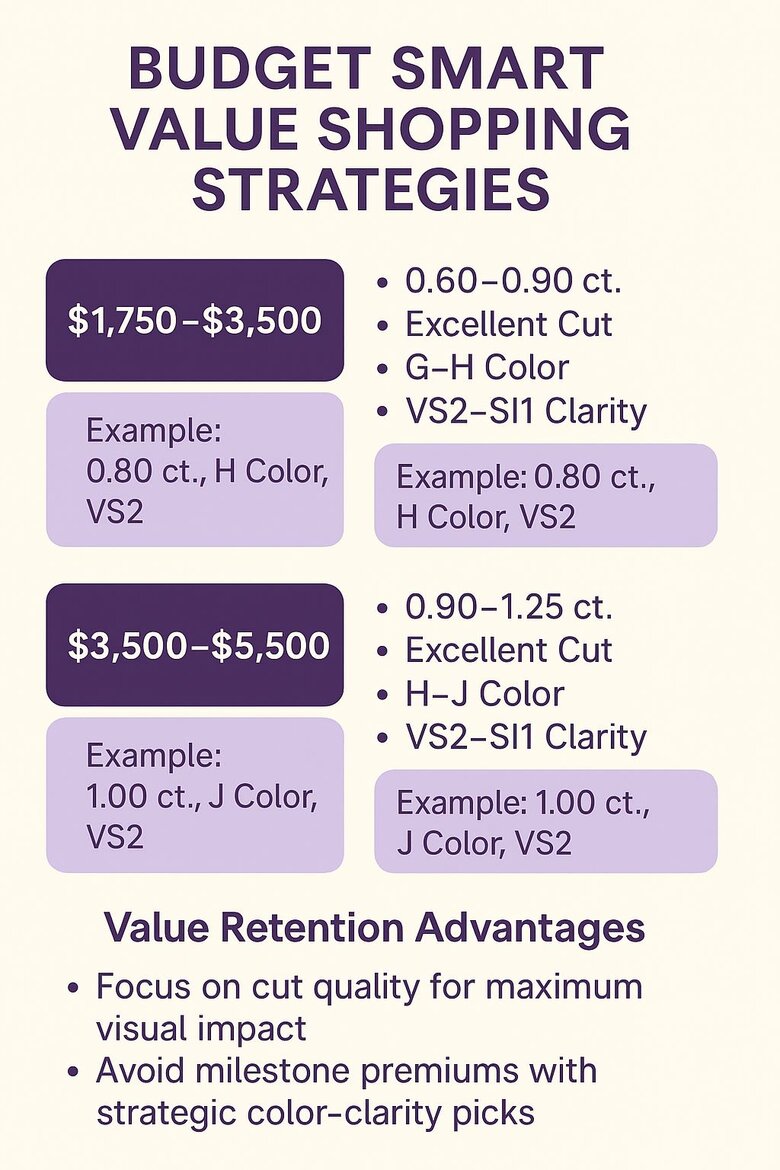
Budget optimization focuses on strategic specification selection maximizing visual impact while minimizing premium costs. Smart shopping requires understanding which characteristics affect appearance versus market perception.
Different budget ranges unlock specific opportunities. The $1,750-$3,500 range accommodates 0.75-1.00 carat stones with strategic quality combinations. $3,500-$5,500 budgets enable 1.00-1.25 carat diamonds with premium cuts or superior color.
Value-focused selections demonstrate optimal outcomes through emphasis on cut quality and strategic color-clarity combinations rather than maximum carat weight.
Human perception limitations make certain premium grades imperceptible under normal viewing. This creates opportunities to redirect budget toward more visible characteristics.
Milestone premiums can be avoided through weights like 0.90ct, 1.40ct, or 1.90ct. You get 95% visual impact at 15-25% savings compared to round numbers.
Quality grades like Excellent cut and established certification maintain 8-15% value retention advantages, justifying strategic investment in specifications that matter.
Verify Certification Standards That Impact Diamond Prices
Certification standards directly impact pricing through market confidence. GIA Diamond Grading Reports command 5-12% premiums over comparable IGI certification due to conservative grading and established recognition.
Independent lab standards vary significantly in consistency and market acceptance. GCAL certification provides technological verification through advanced imaging, typically supporting 3-8% premiums among technical buyers.
Certification verification in professional laboratories reveals grade variations between major bodies affect market pricing by 8-15% despite identical physical characteristics.
"While certification standards like GIA and IGI are well-recognized in influencing diamond pricing, what is less understood is the significant role technological advancements play in certification processes today. Advanced imaging techniques used in GCAL certifications, for example, allow for a more precise analysis of a diamonds internal characteristics, which can detect subtleties not visible to the naked eye. This level of detail provides a depth of data that supports higher market premiums, particularly among buyers relying on technological validation to ensure the quality and authenticity of their investments."
Diamond origin reports document production methods and supply chain transparency. HPHT vs CVD pricing differences of 3-8% often correlate more with documentation quality than actual method variations.
Grading reports extend beyond basic 4Cs to include fluorescence, polish, and symmetry evaluations. Professional buyers analyze complete documentation to identify value opportunities.
AGS certification employs different methodologies sometimes producing more favorable assessments for specific shapes and proportions. Understanding system variations creates strategic opportunities.
Certification trust influences buyer confidence and premium willingness. Established bodies provide market liquidity advantages supporting long-term value retention—particularly important for higher-value purchases where resale potential affects investment analysis.
Frequently Asked Questions
Professional-grade calculators like StoneAlgo achieve 92-96% accuracy by integrating wholesale market data from actual trades, while consumer calculators often show 15-25% variance. The best tools track real transaction values rather than listed retail prices and account for the unique pricing dynamics of lab-grown diamonds.
You can save 15-25% by choosing a 0.90 carat diamond over a 1.00 carat stone while getting 95% of the visual impact. This occurs because psychological pricing milestones at round numbers like 1.00ct create market inefficiencies where per-carat prices jump dramatically despite minimal visual differences.
Regional pricing variations of 5-10% exist due to certification preferences, distribution differences, and local competition levels. US markets typically command premiums over European markets, while seasonal patterns create additional 8-15% variations between peak engagement seasons and slower periods.
GIA certification commands 5-12% premiums over IGI due to conservative grading and market recognition, but this premium may not always justify the cost difference. For value-focused buyers, IGI certification often provides identical physical quality at lower market prices, especially when the diamond will be set in jewelry.
CVD method diamonds under 1.00 carat show more stable pricing than HPHT alternatives, with typical price differences of 3-8% between methods. However, these differences often correlate more with documentation quality and market perception than actual quality variations in the finished stones.
Prioritize Excellent cut quality first, then strategic color grades (G-J range), followed by VS1-VS2 clarity, and finally optimize carat weight using milestone avoidance. Superior cut quality can visually compensate for lower color grades while maintaining optimal value better than any other specification upgrade.
Purchase during January-March when demand normalizes after holiday seasons, avoiding Q4's 5-8% seasonal premiums. Additionally, lab diamond costs continue declining 8-12% annually, but premium specifications maintain stability, so timing matters more for standard grades than exceptional quality stones.
Premium specifications like Excellent cut and D-F color grades maintain 8-15% better value retention and provide measurable visual improvements in stones above 1.00 carat. However, in smaller stones where human perception can't distinguish adjacent grades, the premium rarely justifies the cost unless emotional significance outweighs financial optimization.